Insights | Reporting tool

Role: UX/UI Designer | Work done for Genius Sports in conjunction with the media UX/UX team
Product overview

Create an independent view for the Insights application called Dashboard that allows you to disaggregate campaign report data based on an established configuration, allowing you to reach different levels of the campaign and that is also adaptable and flexible for the different types of clients that receive your reports through the application.

Update the app following new brand guidelines

Challenges
  • Create a filter adaptable and flexible to the different types of campaigns and levels that make it up
  • Create data visualization metrics that allow information to be segregated into different periods and time measurement
  • Present different graphical data visualization options
  • update the look and feel of the application following the guidelines of the brand design system
  •  
Userflow definition

Insights analytics is an application that has been under construction for approximately 4 years and that throughout this time has had different redefinitions to adapt to the market. In the most recent iteration, a series of interviews and user tests were carried out where it was identified that a large number of the application’s characteristics at that time did not provide any value to the user and provided information with certain discrepancies, therefore, it was defined a user flow with 3 basic features that cover the needs of end users

PerceptualMapInsights
Solution

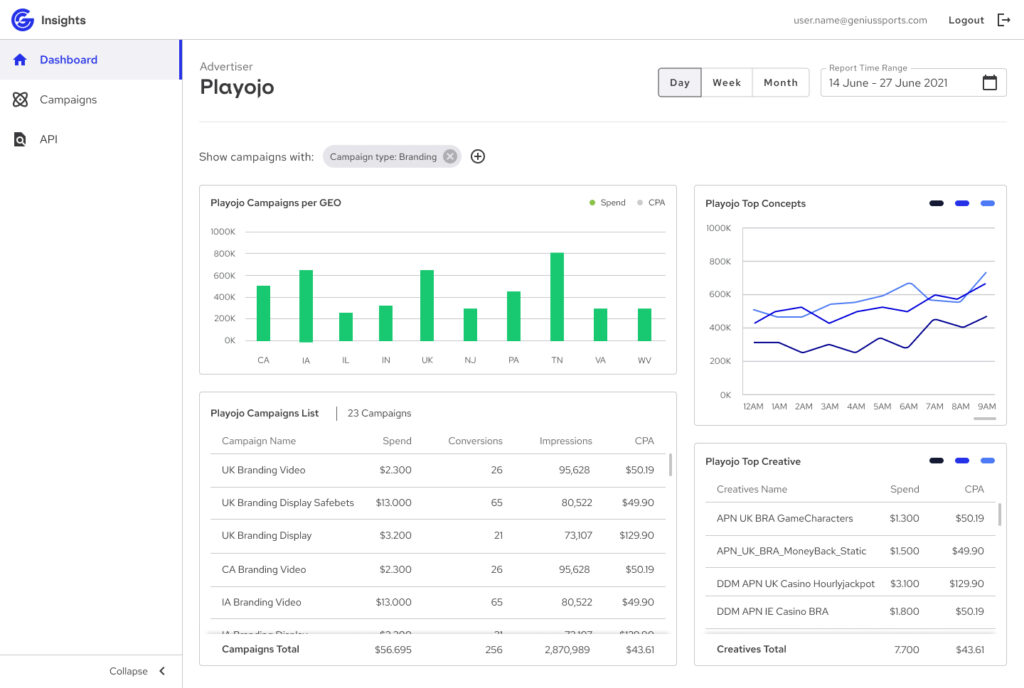
As part of the result, conversational filters were implemented that allowed browsing at different levels of the campaigns and that also provided flexibility to the user when applying them, quick accesses were also implemented for certain periods of time, as well as metrics per hour, week and month.

Dashboard_Menu_Expanded
Dashboard_Menu_Expanded-1
Dashboard_Menu_Expanded-2